BTCUSD · today
Bitcoin (BTC/USD) today: where stops get hit, and when
Updated 24 Sept 2026, 17:38 UTC · refreshed hourly · measured on two years of hourly data
Stop distances at today's volatility
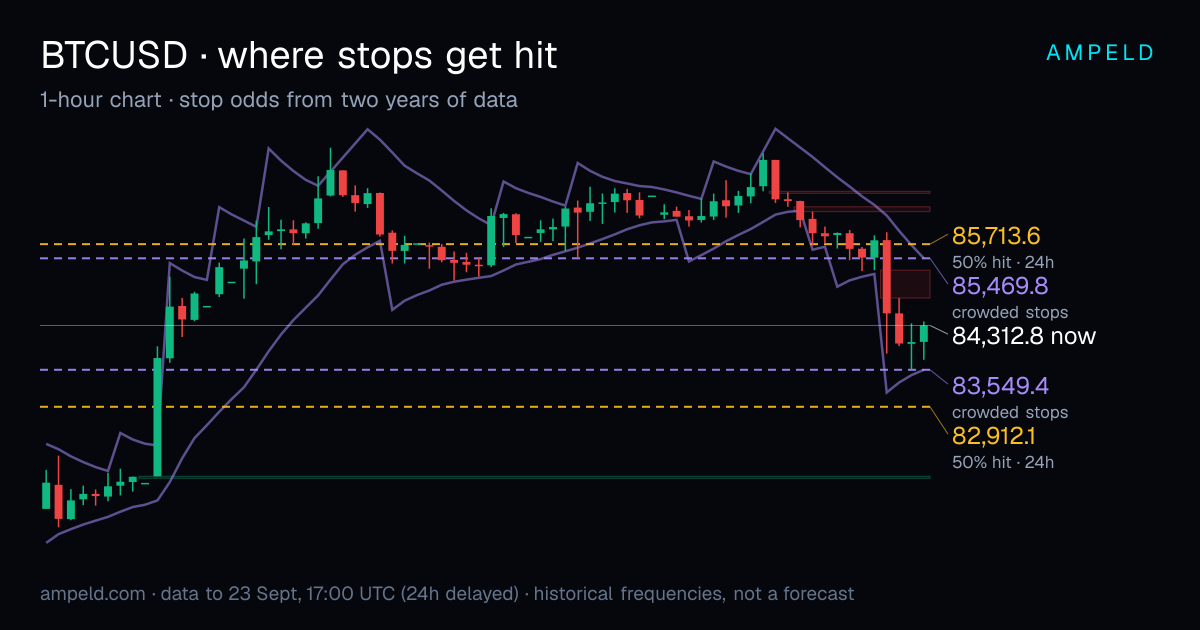
One average true range on the 1-hour chart is $623 right now. At that volatility, a stop about $1,401 from entry was hit within a day about half the time. A stop one ATR ($623) away was hit within a day on 74% of entries, whichever way the trade was pointing.
Busy and calm hours to enter
When you enter matters as much as where the stop sits. A stop one ATR away was hit within 4 hours 39% of the time for trades opened at 18:00 London time (this update's hour), against 41% on average.
- Busiest entry hours (London): 12:00 (56%), 13:00 (60%), 14:00 (59%), 15:00 (53%).
- Calmest entry hours (London): 03:00 (33%), 04:00 (32%), 05:00 (32%), 06:00 (34%).
- Next busy window starts at 12:00 London. A tight stop placed just before it rarely survives it.
Has the day's high or low been made yet?
Share of 720 trading days whose final high and low were already in by each London hour.
| By (London) | High already in | Low already in | Both |
|---|---|---|---|
| 08:00 | 38% | 38% | 4% |
| 12:00 | 47% | 46% | 9% |
| 14:00 | 55% | 56% | 18% |
| 16:00 | 67% | 66% | 35% |
| 18:00 | 74% | 75% | 50% |
| 20:00 | 84% | 85% | 69% |
Before the afternoon a new high or low is still likely even after a wide morning; by late evening most days are done. Chasing a breakout late in the day means betting on the minority of days that still extend.
How the latest crowded-stop levels played out
On 22 Sept, 17:00 UTC the nearest modeled crowded stops sat at 86,801.20 above and 85,881.81 below. Over the following hours the upper one was reached at 23 Sept, 01:00 UTC, and the lower one was reached at 23 Sept, 08:00 UTC.
From the free model, which runs 24 hours behind (data to 23 Sept 2026, 17:00 UTC). Crowded stops are modeled from price and volume, not broker order data. Misses are shown as plainly as hits.
Historical frequencies from two years of hourly candles, recalculated weekly; stop distances priced at the current 1-hour ATR. Not a forecast and not investment advice. Your broker's spread makes a stop act slightly closer, and more so around the daily rollover (22:00 UTC).